The State of Cultural Institutions
A year of ticket and membership data from ACME museums, zoos, aquariums, gardens, and historical sites, and what it means for how you price, market, and staff.
More Than A Ticket

The decision happens two weeks out
On average, 13.32 days pass between the moment a ticket is purchased and the visit itself. Your marketing window is measured in weeks, not months.
purchase to visit
Two weeks is enough room for a real sequence, not a single reminder. Time your paid retargeting and pre-visit emails to land inside that window, and make date-specific availability visible from your homepage so a visitor planning ahead can act on it in one click.
Most purchases include more than one ticket
Two numbers set the baseline for how you price and package admission: what a transaction is worth, and how many tickets it typically includes.

At 3.1 tickets a transaction, most buyers are purchasing for two or three other people. Price and package for it: extras a whole party can use, like a cafe or gift shop credit, household and family memberships, and timed-entry pricing tested on your peak days. Lifting the average order a few dollars moves more revenue than chasing single-ticket volume.

Online is 1 in 3 orders,
and almost half the revenue
Online checkout accounts for 32.16% of orders but 44.75% of revenue. The average online order is $121.57, against $64.16 at the front desk. That is a $57 gap per order.
Average Order Value
- 44.75% of order revenue
- 32.16% of order count
- The highest-value channel
Average Order Value
- 40.87% of order revenue
- 53.98% of order count
- The volume engine, at the lowest order value
Average Order Value
- 14.39% of order revenue
- 13.86% of order count
- Reseller, phone and inside sales
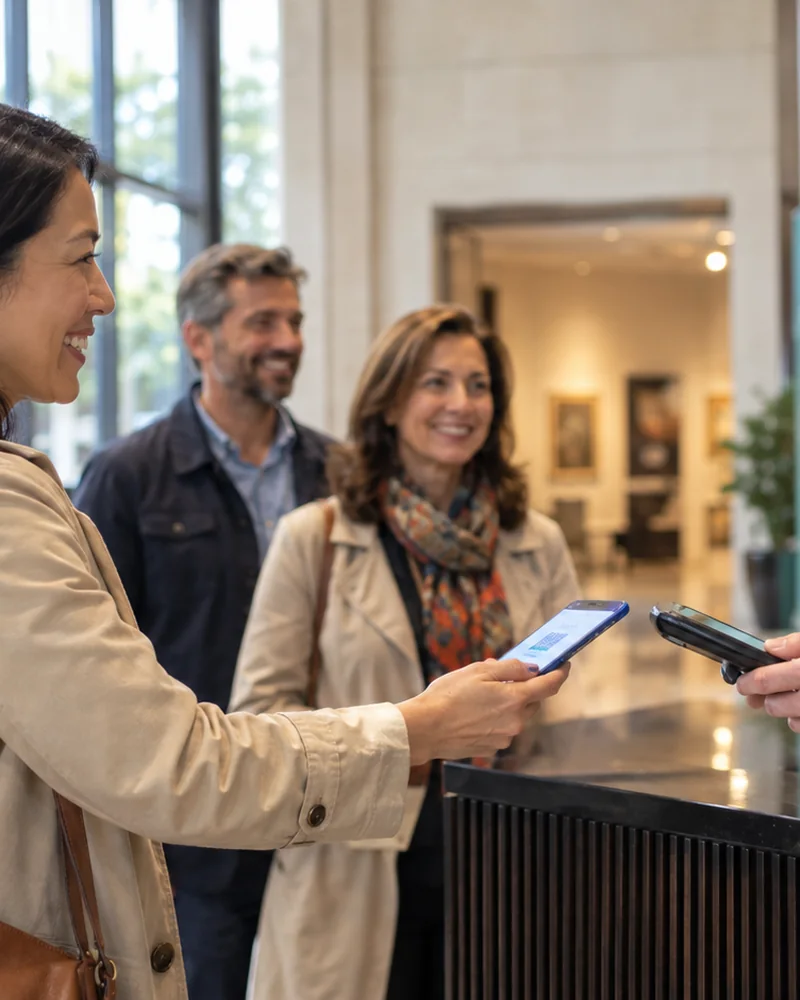
Every order you move from POS to online checkout is worth $57 more on average. Put timed-entry booking one click from your homepage, prompt pre-purchase on your Google Business Profile, and let the front desk point walk-ups to a QR code when the line builds.
6 in 10 visits land on a weekend
Buying and visiting have different rhythms. Purchases spread more evenly across the week; attendance concentrates on the weekend. Saturday alone is 20.43% of purchases but 22.95% of visits.

Saturday and Sunday together carry 59.25% of visits, and Friday has climbed to 17.74%. Treat Friday through Sunday as one peak block when you schedule staff and timed entry. Tuesday is the quietest day on the floor at 8.62% of visits: point group bookings, school visits, and promotions there instead of adding them to an already full weekend.
There is no off-season
Visits spread across the calendar: the busiest month (July, 10.22% of visits) is less than 2x the slowest (February, 5.95%). Summer peaks, but no month goes dark.
Plan programming for the full calendar, not around a single season. Use the February trough for maintenance and installation windows, spring school bookings, and facility rentals instead of dark days, and protect July staffing before summer starts.
Mobile buyers convert. They just spend $27 less.
Phones and desktops close at almost the same rate, 17.6% against 18.4%. The gap is in the basket: a desktop order averages $88.16 to mobile's $61.27, 44% more. Mobile visitors are just as ready to buy, but they spend less doing it.

Mobile already converts as well as desktop, so the funnel is not the problem. The $27 gap is basket size. Make add-ons, group tickets, and membership upgrades as easy to tap as they are to click, and check whether your upsell step is the one being skipped on a small screen.
Membership converts half the time
Of visitors who begin a membership checkout, 51.1% complete it. Standalone ticket checkouts complete at 30.5%. Intent to join is strong: the visitors who start that flow overwhelmingly mean it.
of visitors who start a membership purchase complete it.
median checkout time
of visitors who start a membership purchase complete it.
of visitors who start a standalone ticket purchase complete it.
median checkout time
Time from entering checkout to completed purchase.
The membership flow finishes more often than the ticket flow, so the constraint is how many people reach it, not what happens once they do. Membership decisions cluster around two moments: the point of admission, where membership can be compared against the ticket total a family is about to pay, and the days after a good visit, when they already know they want to come back. Make the case in both places, not only on a membership page.
Where culture meets commerce
Every benchmark on this page comes from institutions running ACME: ticketing, membership, and point of sale in one platform built for cultural institutions.
Intelligent Ticketing
Intuitive online booking with a seamless point of sale, built to move lines and sell more tickets.
Memberships & Donations
Online upsells, auto-renew memberships, and more ways to turn first-timers into all-timers.
Data & Reporting
Thousands of data points with fully customizable reporting, so decisions like the ones on this page are yours to make.
Open API
Limitless design possibilities and connections to the third-party tools your institution already runs on.

"ACME has transformed the way guests and staff engage with ticketing and membership sales processes. Transactions at the ticketing desk are fast, the online process is intuitive, and the connection to Raiser's Edge aids in our back office tasks."
See your own numbers next to these
ACME's reporting puts every benchmark on this page one click away for your institution. Get a demo and see where you stand.


© Copyright ACME Ticketing.